University Class Utilization Analysis
in Power BI
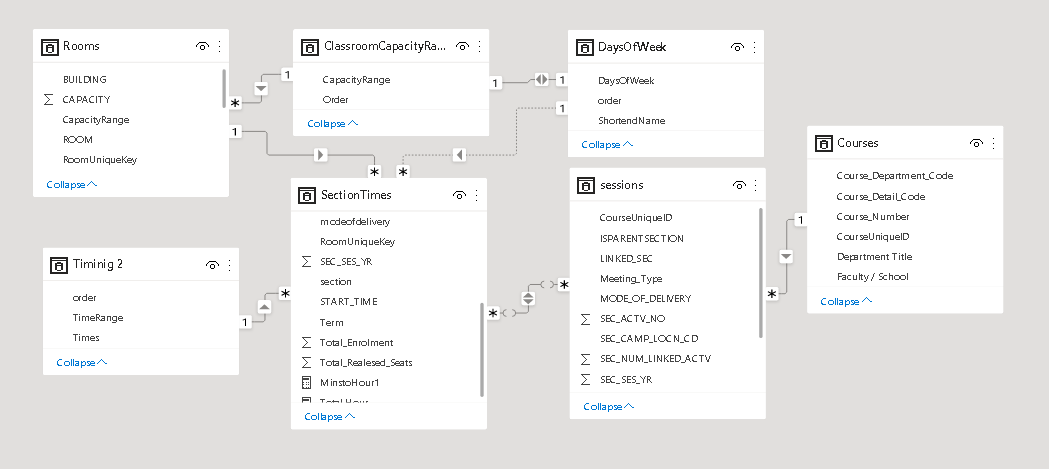
This Analysis helps the University find the effective utilization of their teaching spaces which is critical to delivering all their learning activities. The Analysis evaluates how well business stakeholders in universities utilize their teaching spaces. The goal is to develop and frame strategies that the University and its stakeholders can consider to strengthen scheduling and space management in teaching and learning excellence. to do this aftre cleansing a raw data, try to find relationship diagram which is shown as bellow image.
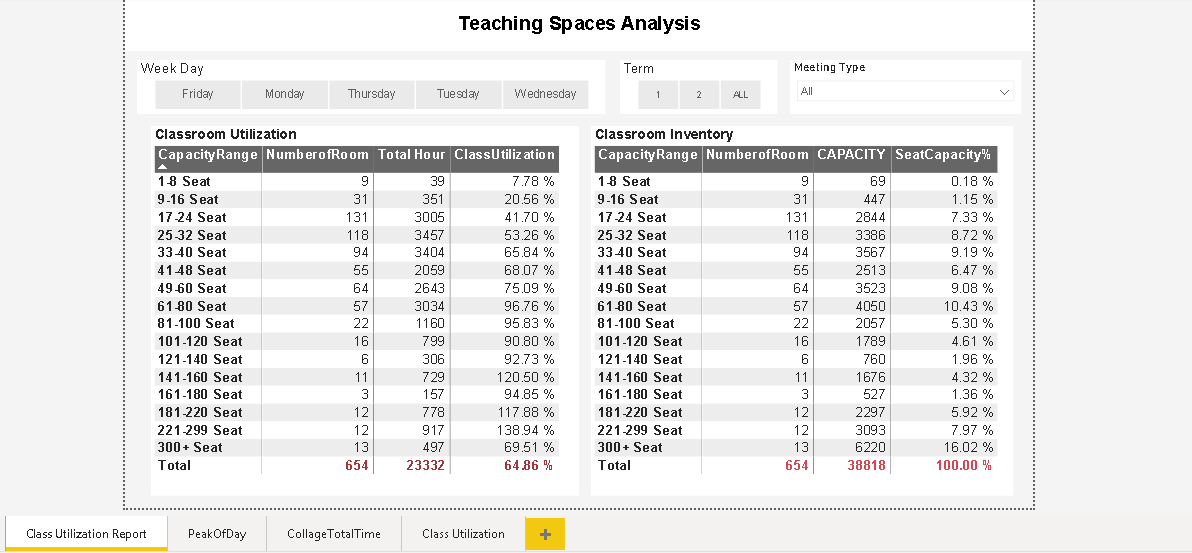
The utilization analysis of instructional rooms presented in this report uses Office of the Registrar data records for centrally controlled classrooms and teaching laboratories for two semesters in 2021. The right table in the below image is a review of classroom area per seat allocation shows the amount of space allocated per seat.
The left Table is An analysis of classroom utilization that provides a profile of the centrally scheduled rooms' rates. Results indicate unused capacity within the classroom pool across the scheduling week.
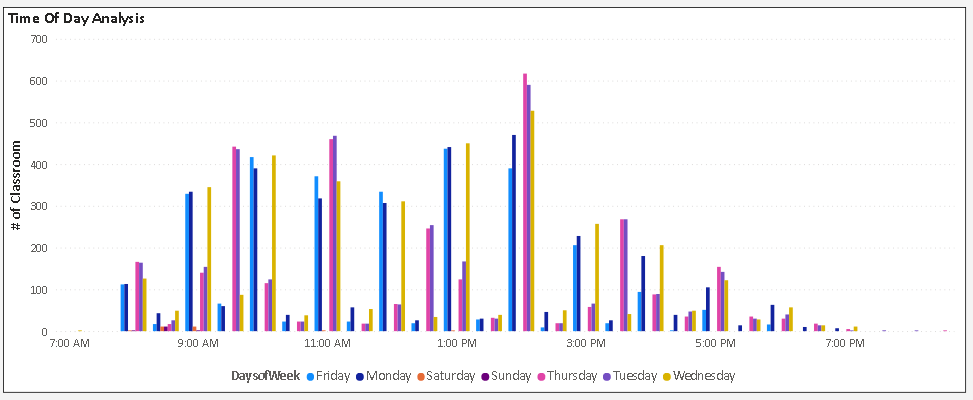
the overall pattern is typical of a large institution with high activity between 9 AM and 4 PM.
* High rates of scheduled use seen through the late afternoon and early evening are more unusual.
* all days except weekends at 2 PM have the highest class usage in the graphics.
* The highest number of classrooms used at one time is more than 612 of 654 rooms (93%) in 2021.
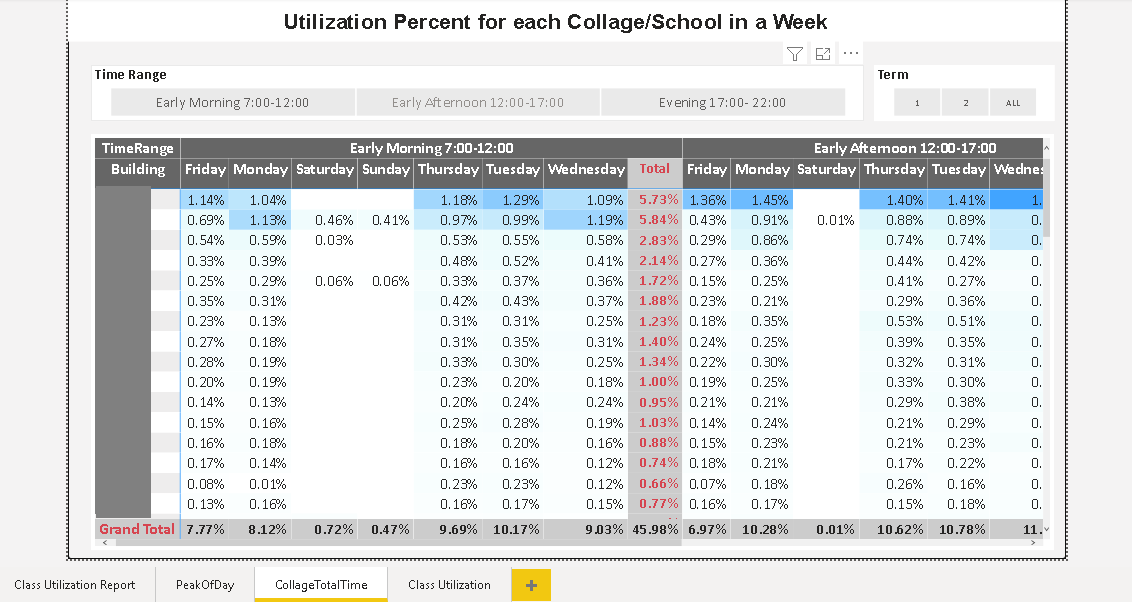
bellow Analysis shows an image to define the time of day use by college/school course events